F&B Market Outlook
Learn More
New / Closed Restaurants
NEW
CLOSED
District
NEW
CLOSED
Cuisine
NEW
CLOSED
Dish Type
NEW
CLOSED
Restaurant Type
NEW
CLOSED
Restaurant Distribution ()
Causeway Bay
Korean
No. of Restaurants
29 (Independent: 12, Chain: 17)
Proportion in the District
2.5%
Spending per Head
$144-$185
Restaurant Lifespan
Median of restaurant survival rate for the past 12 years
  1. Paterson Street
    4.9 yrs
  2. Independent Restaurants
    5.3 yrs
  3. Pizza
    5.9 yrs
  4. Kowloon City
    7.8 yrs
  5. Oyster Bar
    8 yrs
  6. Chain Restaurants
    10.6 yrs
Consumer Insights
Learn More
Dining Trends
This percentage represents users' dining preference and intention towards different districts / dish types compared to last month (monthly change in search volume).
See Dining Trends
Find out users' dining trends by district/ dish type:
Please select both district and dish type.
Check Now
Reset
District Trends
{{districtsList[3003]}}
{{districtsList[3018]}}
{{districtsList[1019]}}
What's Trending ()
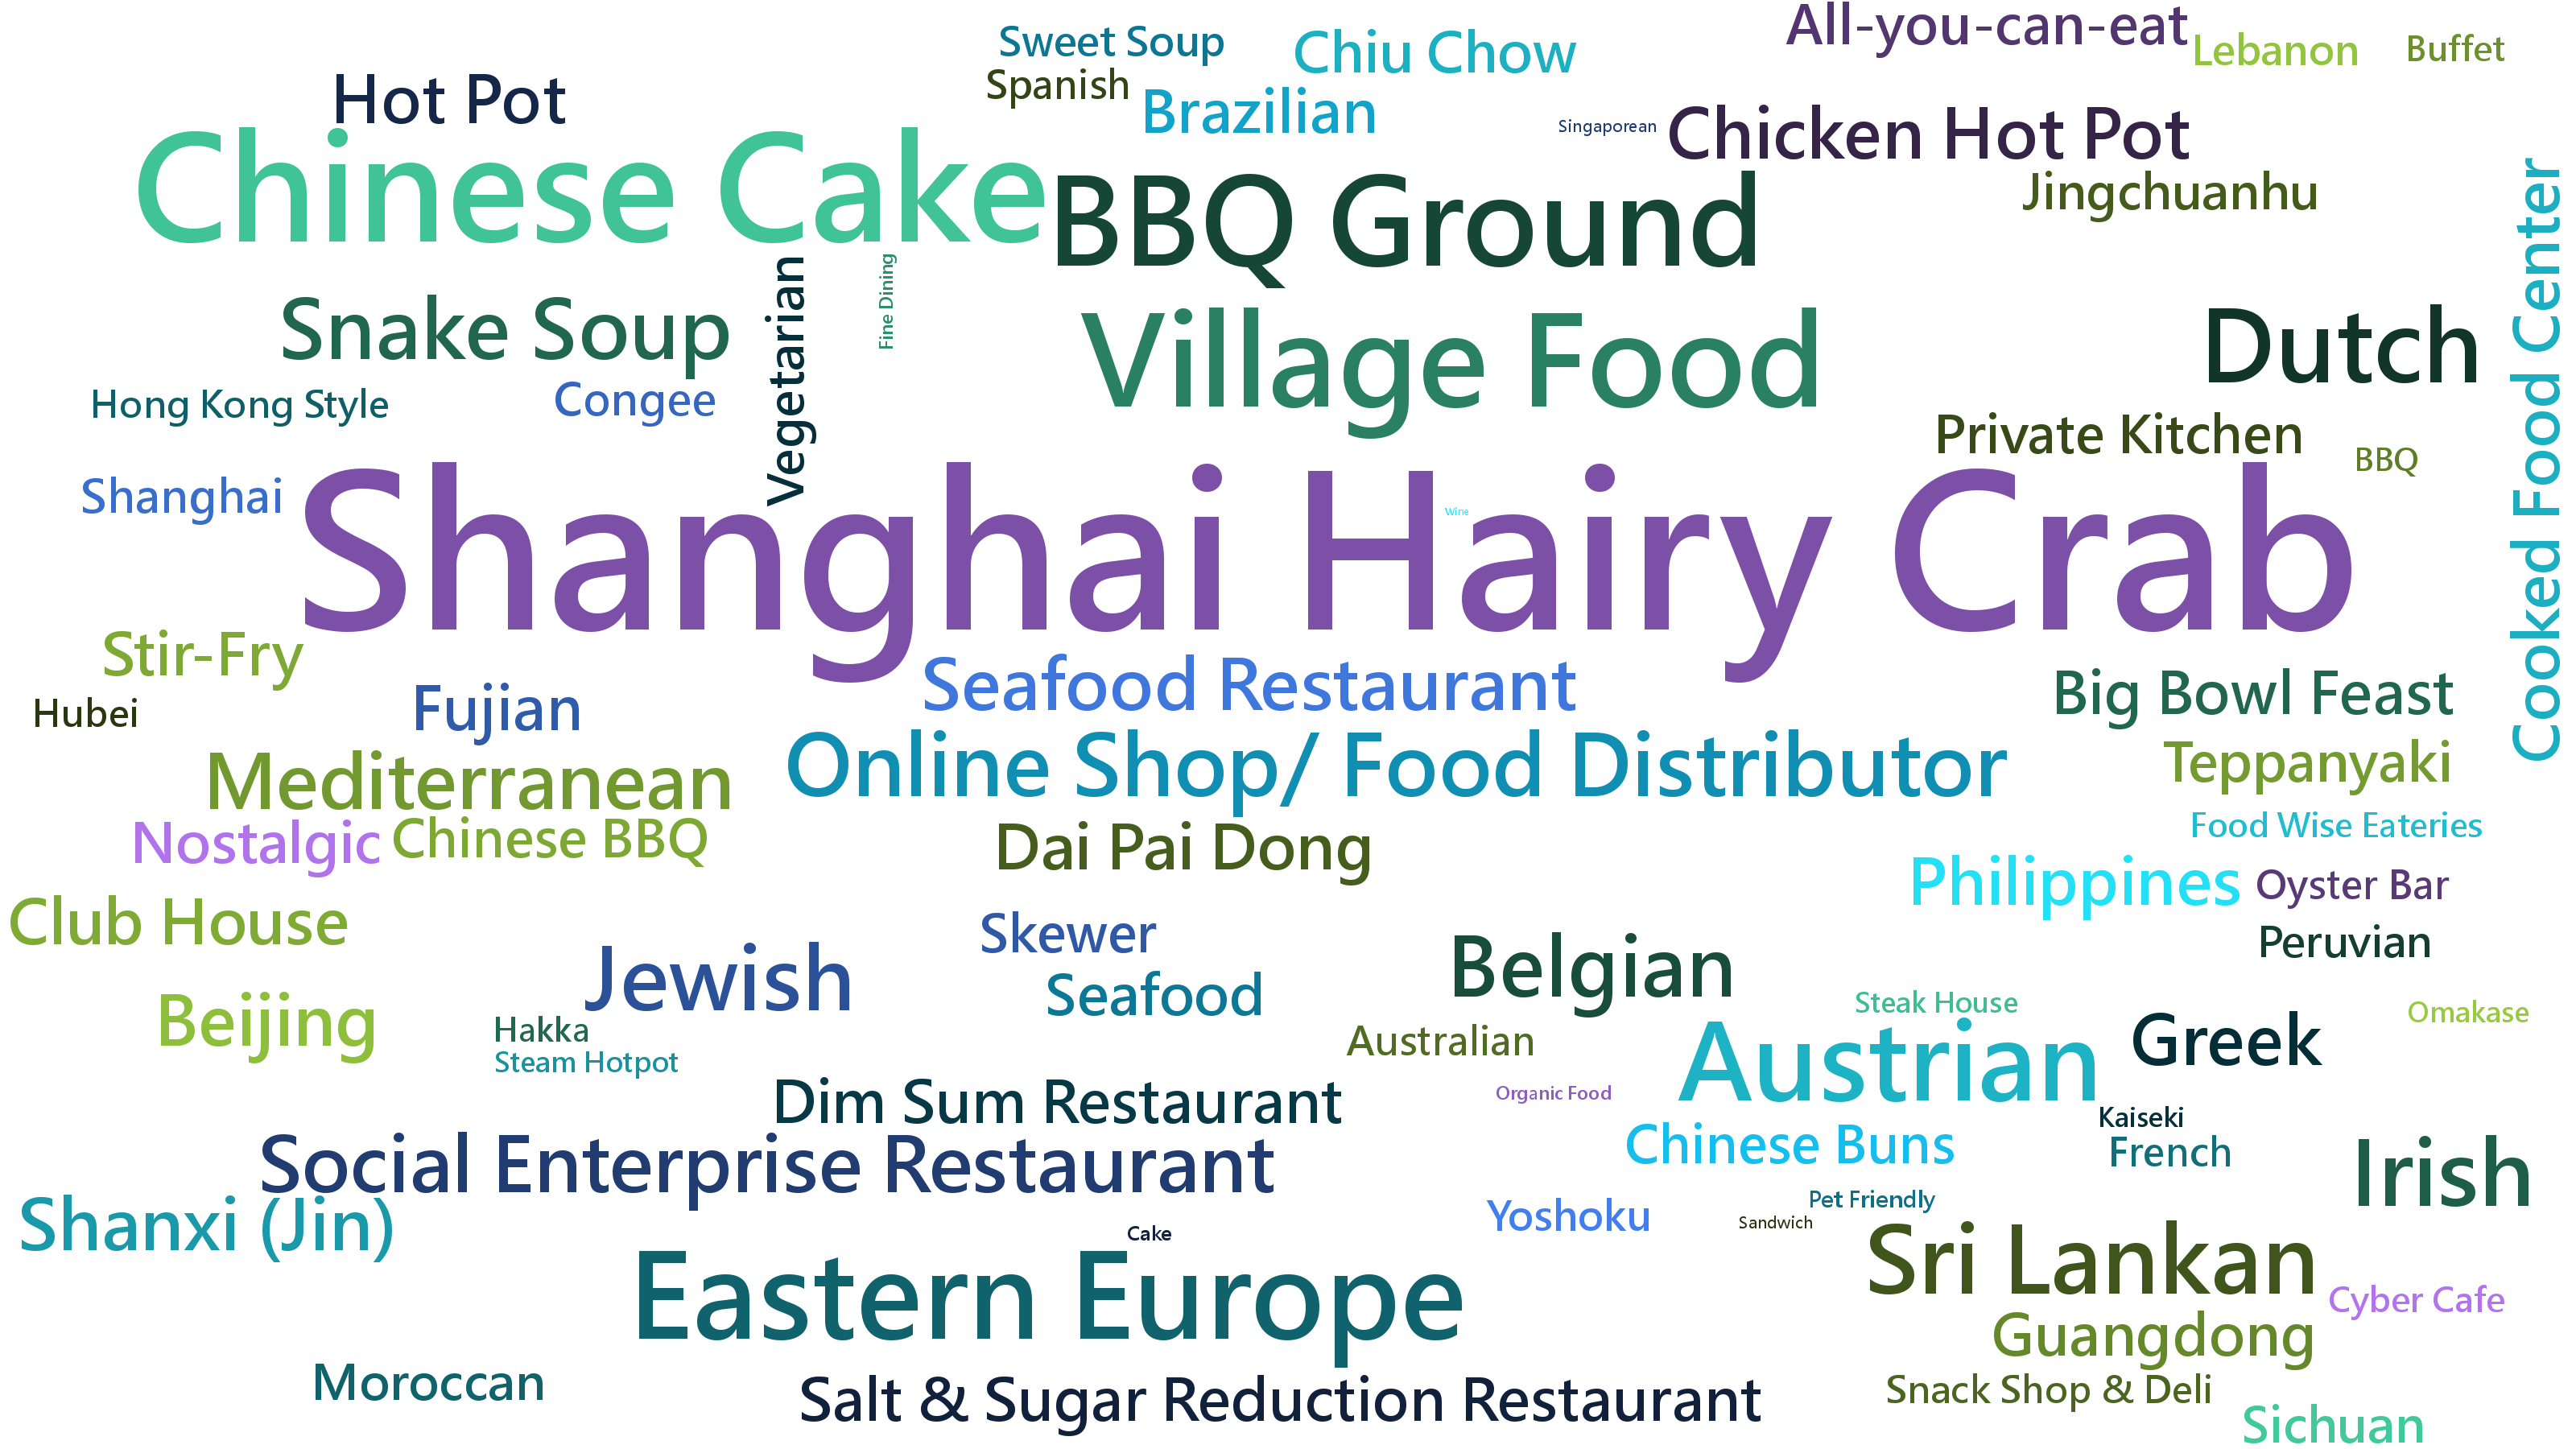
Top 10 Popular Search in HK
{{ item }}
{{ item }}
Audience Profile
Active Restaurants: {{ filteredAudienceProfileData.active }}
Addressable Markets
(Unique active registered users)
Total Addressable Market
Interest Audience
Monthly active users who searched / viewed related restaurant pages
{{ filteredAudienceProfileData.interest }}
Fans Audience
Monthly active users who bookmarked / reviewed related restaurants
{{ filteredAudienceProfileData.fans }}
Core Audience
Monthly active users who visited / purchased at related restaurants
{{ filteredAudienceProfileData.core }}
Top 5 Frequent Location
Core Audience
Fans Audience
Total Addressable Market
Age
(Fans Audience)
Gender
(Fans Audience)
Female
{{ filteredAudienceProfileData.female }}
Male
{{ filteredAudienceProfileData.male }}
Spending Power
(Fans Audience)
High
{{ filteredAudienceProfileData.high }}
Mid
{{ filteredAudienceProfileData.mid }}
Low
{{ filteredAudienceProfileData.low }}
Source: Jan 2020 OpenRice Big Data